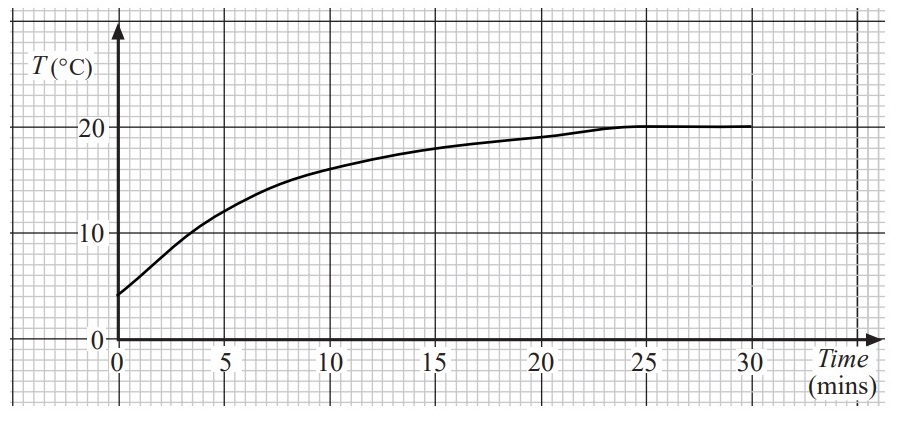
The graph shows how the temperature of can of drink increases after it has been taken out of the fridge.
Find the rate of change of temperature with respect to time when `t=10`.
Give your answer to `1` significant figure.
Your Answer:
You did not answer this question.