The box plot shows the distribution of the time that people waited to be served at Green's garden centre.
Calculate the interquartile range.
Your Answer:
You did not answer this question.
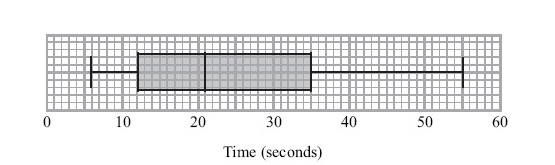
The box plot shows the distribution of the time that people waited to be served at Green's garden centre.
Calculate the interquartile range.
You did not answer this question.