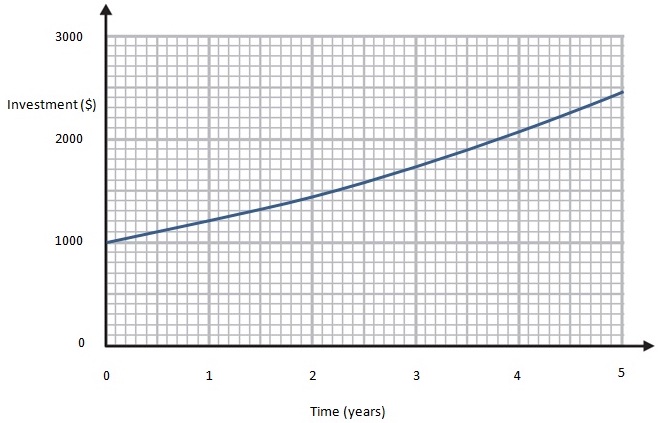
The graph shows the value of an investment in the first `5` years of growth.
`t` is the time in years.
Find the rate of increase of the investment at `t = 2` to `2` significant figures.
Your Answer:
You did not answer this question.
The graph shows the value of an investment in the first `5` years of growth.
`t` is the time in years.
Find the rate of increase of the investment at `t = 2` to `2` significant figures.
You did not answer this question.