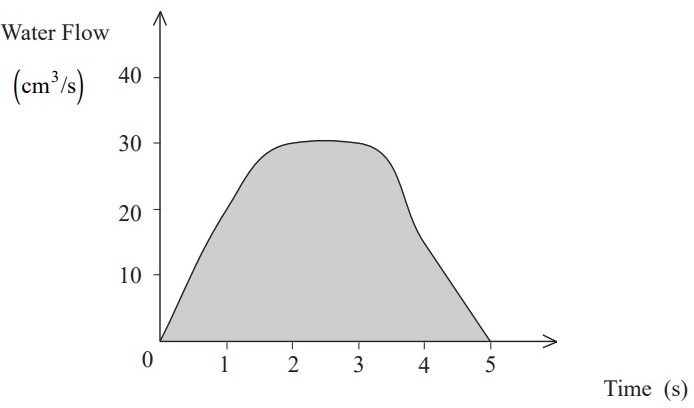
The graph shows how the rate at which water flows through a pipe varies with time.
Find an estimate for the volume of water that flows through the pipe in the given time interval.
Your Answer:
You did not answer this question.
The graph shows how the rate at which water flows through a pipe varies with time.
Find an estimate for the volume of water that flows through the pipe in the given time interval.
You did not answer this question.